This is a guest post to the Sensu Blog by Michael Eves, member to the Sensu community. He offered to share his experience as a user in his own words, which you can do too by emailing community@sensu.io.
If you’re using Sensu then you most likely already have node level monitoring nailed down to a tee; you’ve probably got some disk usage checks, cpu, memory, etc… the whole shebang.
What about if you’re monitoring a distributed service such as Elasticsearch, where the health of that service exceeds the scope of a single node? Well, you probably have that nailed down too. With the use of a roundrobin check and a proxy client a simple check against Elasticsearch’s cluster health endpoint will tell you all you need to know; healthy or not.
Where things become more difficult is when you have a service that doesn’t provide its own definition of whether it’s healthy or not; you need to determine what makes it unhealthy and create checks accordingly.
Scenario
Let’s say for example we have 4 web servers that sit behind a load balancer and serve up some images. The difficulty here is that these web servers don’t even know about each other, they’re unable to tell you the current state of the service as a whole. We’re monitoring these servers with Sensu using a basic HTTP check that curls localhost on 8080 and checks for a 200 response, so we do know the health of each individual node.
Now if one node goes down it’s something we’d want to know about, but probably not enough of a concern to get woken up at 2am for. If we lose two nodes however we’re approaching the danger zone, and we want someone to intervene.
So, we don’t want to get notified for one node down, but we do for two. Let’s take it one step further and assume we’re anticipating a massive growth in traffic so we scale up, or autoscaling does this for us. We’re now sitting at 30 nodes, rather than 4. Suddenly, two nodes going down is less of a concern; we now only care if more than 6 are down.
What is it then that we need to effectively monitor this service? Well we need to be able to aggregate the health of all our nodes and then decide whether the service is healthy based on a ratio of our HTTP check results. This is where Sensu Aggregates come in.
Aggregates
Sensu named aggregates are collections of check results, accessible via the Aggregates API. Check aggregates make it possible to treat the results of multiple disparate check results — executed across multiple disparate systems — as a single result
Above is the definition of Sensu aggregates taken from the Sensu docs themselves. Essentially, we can group results of different checks from different clients into a single result and then use that result to effectively determine the health of a system.
We’ll use our web server example to show how we can get up and running. To begin aggregating a check you simply need to add "aggregate": true to your check definition. This will create an aggregate based on the checks name:
{
  "checks": {
    "frontend_web_health": {
      "command": "/opt/sensu/embedded/bin/check-http.rb -u http://localhost:8080/health",
      "handle": false
      "subscribers": [
        "web"
      ],
      "interval": 60,
      "ttl": 180,
      "aggregate": true
    }
  }
}
Note: I’ve also set "handle": false since we’ll be alerting off the aggregate, not the individual check results.
Now that the check is running across our 40 nodes and is being aggregated we can see an overall view of our service by hitting the aggregates API, and specifying our aggregate name:
$ curl http://localhost:4567/aggregates/frontend_web_health

{
 "clients": 40,
 "checks": 1,
 "results": {
 "ok": 37,
 "warning": 0,
 "critical": 3,
 "unknown": 0,
 "total": 40,
 "stale": 0
 }
}
Awesome! Now we just need to add a check that hits the API for this aggregate and determines if the service is healthy or not based on the number of ok/warning/critical results. Fortunately there is already a community plugin that comes with a check to do this, check-aggregate.rb.
You can install the plugin using the sensu-install utility:
sensu-install -p sensu-plugins-sensu
Our check definition is going to look something like the below:
{
 "checks": {
   "frontend_web_health_status": {
     "command": "/opt/sensu/embedded/bin/check-aggregate.rb --check frontend_web_health --critical 20 --age 180",
     "subscribers": [
       "roundrobin:sensu-server"
     ],
     "handlers": [
       "mail"
     ],
     "interval": 60,
     "source": "web_frontend"
   }
 }
}
Let’s quickly break down this check defintion:
--check frontend_web_health — This flag specifies the aggregate name to check.
--critical 20 — The percentage of aggregated results that need to be critical for this check to return critical.
--age 180 — How old results in the aggregate need to be before they are considered stale. (I’ve set this to match the TTL of the front_web_health check created earlier).
"subscribers": ["roundrobin:sensu-server"] — We’ll run the aggregate check on one of our Sensu servers, since it is just querying the API. (Note: You must create this subscription, it doest not exist by default).
"source": "web_frontend" — Creating a proxy client for this check will allow us to view the health of our service on a single client, web_frontend.
"handlers": ["mail"] — As mentioned earlier, it makes sense to alert off this check rather than the individual results.
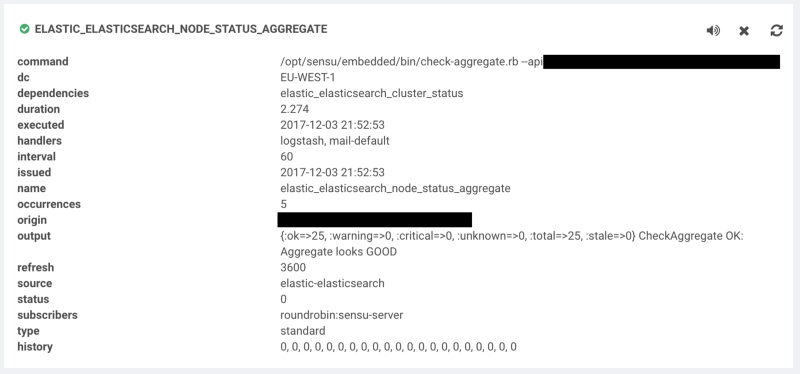 Example check output for an aggregated group of nodes
So that’s how you can use aggregates to bring together check results for disparate clients to provide a single check of a basic services health. Read on for how this can be expanded for more complex systems
aggregate(Your Aggregates)
We’ve seen how we can create an aggregate of a single check across many nodes, but what if our service has more than one indicator of health, and what if these indicators have different weights in determining if a service is healthy.
A way to tackle this is to write checks for these different indicators, aggregate the results of those checks, and then aggregate the results of those checks. Ultimately we want to create a single check to alert on that can tell us in overall terms if a service is healthy or not.

Before I continue it’s worth saying that I have not come across this setup elsewhere which may be for good reason. If you simply want to reduce the amount of alerts you receive when a service goes down you should first consider if check dependencies covers your use case. With that being said… onwards!
Sensu’s very own RabbitMQ is a service in which you can determine health in a variety of ways. Before we write any checks, we can decide what circumstances we would deem our RabbitMQ cluster as needing attention:
- A single node reporting network partitions
- Two or more RabbitMQ nodes down
- More than 10,000 messages in a single queue
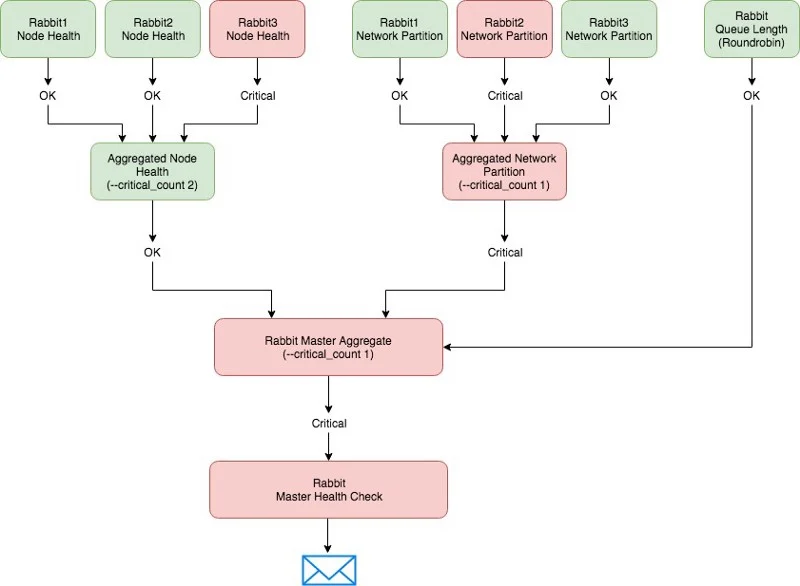
There may be more than just the above, but we’ll stick with just those three to give an idea. The diagram below illustrates what we’re going to setup and how it can be used to provide a single view of a services health.
Let’s set up all our checks that’ll allow us to meet the above design:
RabbitMQ Queue Thresholds
{
 "checks": {
   "sensu_rabbitmq_queue_threshold": {
     "command": "/opt/sensu/embedded/bin/check-rabbitmq-messages.rb -q -w 600 -c 1000",
     "subscribers": [
       "roundrobin:sensu-rabbitmq"
     ],
     "source": "sensu-rabbitmq",
     "interval": 60,
     "ttl": 180,
     "aggregate": "sensu_rabbitmq_master"
   }
 }
}
There’s no need to run this check on all the RabbitMQ nodes as they’ll all return the same result, since the queues exist at the cluster level. Since we’re running this as a roundrobin check, there’ll only ever be one result for this check. This means we don’t need to aggregate the results of this check as in essence it’s already been done; we have a clear indication of whether, from the perspective of queue lengths, our cluster is healthy or not. As such, we can aggregate this result into the sensu_rabbitmq_master aggregate.
RabbitMQ Network Partitions
{
 "checks": {
   "sensu_rabbitmq_network_partitions": {
     "command": "/opt/sensu/embedded/bin/check-rabbitmq-network-partitions.rb",
    "subscribers": [
      "sensu-rabbitmq"
    ],
    "interval": 60,
    "ttl": 180,
    "aggregate": true
   }
  }
}
In this case the check is going to run against each individual node so we’ll want to aggregate these results, and then run another check against that aggregate to determine if, from the perspective of networking partitioning, our cluster is healthy or not. We’ll then send the result of that check into our master aggregate:
{
 "checks": {
   "sensu_rabbitmq_network_partitions_aggregate": {
     "command": "/opt/sensu/embedded/bin/check-aggregate.rb --check sensu_rabbitmq_network_partitions --critical_count 1 --age 180",
     "subscribers": [
       "roundrobin:sensu-server"
     ],
     "aggregate": "sensu_rabbitmq_master",
     "interval": 60,
     "source": "sensu-rabbitmq"
   }
  }
}
RabbitMQ Node Health
{
 "checks": {
   "sensu_rabbitmq_amqp_aliveness": {
     "command": "/opt/sensu/embedded/bin/check-rabbitmq-amqp-alive.rb",
     "subscribers": [
       "sensu-rabbitmq"
     ],
     "interval": 60,
     "ttl": 180,
     "aggregate": true
    }
  }
}
Again, we aggregate the results and then perform an overall check, which is aggregated further into our master aggregate:
{
 "checks": {
   "sensu_rabbitmq_amqp_aliveness_aggregate": {
     "command": "/opt/sensu/embedded/bin/check-aggregate.rb --check sensu_rabbitmq_amqp_aliveness --critical_count 2 --age 180",
     "subscribers": [
       "roundrobin:sensu-server"
      ],
     "aggregate": "sensu_rabbitmq_master",
     "interval": 60,
     "source": "sensu-rabbitmq"
    }
  }
}
Master Health Check
Now that we’ve configured all our checks we should be able to see the aggregated results, under our master aggregate.
$ curl localhost:4567/aggregates/sensu_rabbitmq_master

{
 "clients": 1,
 "checks": 3,
 "results": {
   "ok": 3,
   "warning": 0,
   "critical": 0,
   "unknown": 0,
   "total": 3,
   "stale": 0
 }
}
Now it’s a simple case of creating one last check to determine if our RabbitMQ cluster is healthy or not:
{
 "checks": {
   "sensu_rabbitmq_master": {
     "command": "/opt/sensu/embedded/bin/check-aggregate.rb --check sensu_rabbitmq_master --critical_count 1 --age 180",
     "subscribers": [
       "roundrobin:sensu-server"
     ],
     "handlers": [
       "mail"
     ],
     "interval": 60,
     "source": "sensu-rabbitmq"
    }
  }
}
We’ve set --critical_count 1 here since the results in this aggregate are an overall view of different aspects of our cluster. If there are any critical results in this aggregate, it is a clear sign that something is wrong and needs attention.
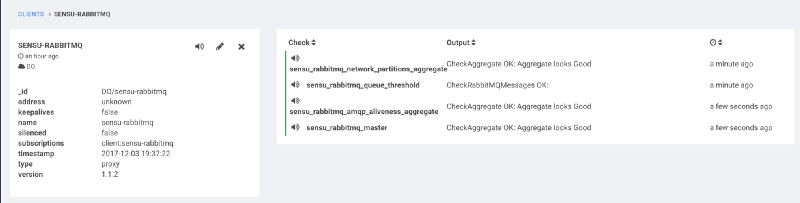 A unified view of our RabbitMQ clusters health
Alert Context
One of the main drawbacks of aggregating down multiple levels like this is that you begin to lose context in the output from check-aggregate.rb. If we were to receive an alert now for this master check the output would look something like the below:
{:ok=>2, :warning=>0, :critical=>1, :unknown=>0, :total=>3, :stale=>0}

CheckAggregate CRITICAL: Number of nodes down exceeds threshold (1 out of 3 nodes reporting not ok)
This is pretty meaningless to us. All we know from this is that one of our “health definitions” is failing, but we have no idea which one. Fortunately, the recent introduction of check hooks means we can extract more information should our check fail.
By adding a check hook to our master check we can call the Sensu API and find out which aspect of our cluster is unhealthy:
"checks": {
  "sensu_rabbitmq_master": {
    "command": "/opt/sensu/embedded/bin/check-aggregate.rb --check sensu_rabbitmq_master --critical_count 1 --age 180",
    "subscribers": [
      "roundrobin:sensu-server"
    ],
    "handlers": [
      "mail"
     ],
    "interval": 60,
    "source": "sensu-rabbitmq",
    "hooks": {
      "non-zero": {
        "command": "curl -s localhost:4567/aggregates/sensu_rabbitmq_master/results/critical | jq .[].check --raw-output",
        "timeout": 10
      }
     }
   }
  }
}
I’ve used jq here to strip the output of the aggregates API to display only the check name, you may choose to leave this out in order to get the entire output. Now we can see the output of our check hook in the client view:
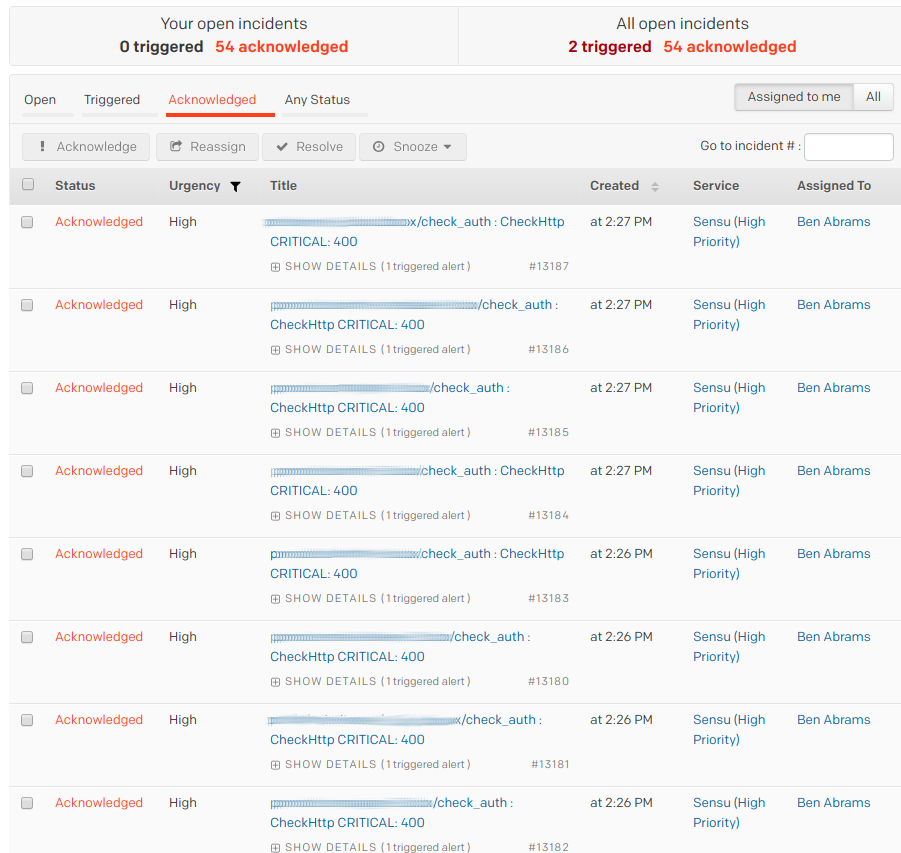
 Check hooks allow you to extract additional information for extra context when debugging an issue
Wrap Up
Hopefully this has given you an understanding of how aggregates can work at a basic level, and how they can also be extended out to fit the needs of more complex services.
Personally I think aggregates are great, especially for simple web services as we showed in the first example. For more complex systems like RabbitMQ they can really help reduce noise by having a single master check for your entire service, but it can become unwieldy due to the amount of additional check definitions that need to be created. With that in mind I’d only choose this approach if others, such as using Sensu’s check_dependencies, is not going to work for you
What next for aggregates? What would I like to see?
I believe aggregates have great potential to really fill a gap in monitoring that of other tools I’ve worked with simply can’t, and I’m excited to see the creative ways in which people will utilise them going forward.
Perhaps you could aggregate checks in an entire datacenter to determine if a datacenter is unhealthy, and automate failover to a passive DC if this is the case? Or maybe you can use aggregates to determine the health of your external services and automate updates to the likes of statuspage.io?
One thing I’d like to see, similarly to how check hooks allows a non-zerovalue for check statuses in which the hook should be run, is the /aggregates/:check:/results/ endpoint to accept a non-zero value to display all warning/critical/unknown clients
Thanks for reading!
Thanks to Matthew (Brender) Broberg.
Related Posts

Alert fatigue, part 4: alert consolidation
In part 4 in this series on alert fatigue, Community Maintainer Ben Abrams covers alert consolidation, which helps you cut through the “white noise” and focus on what's important (especially in the middle of a major incident).

Workflow automation for monitoring: 5 things to know about the Sensu Observability pipeline
The collection of monitoring data is essentially a solved problem; the challenge is connecting that data with the systems and tools you rely upon. In this post, Sensu CEO Caleb Hailey describes how approaching monitoring as a workflow can help.

Made with #monitoringlove by SensuTM in Canada 🇨🇦 and the USA 🇺🇸. © 2017-2021 – Privacy Statement – Terms & Conditions